Sprint burndown
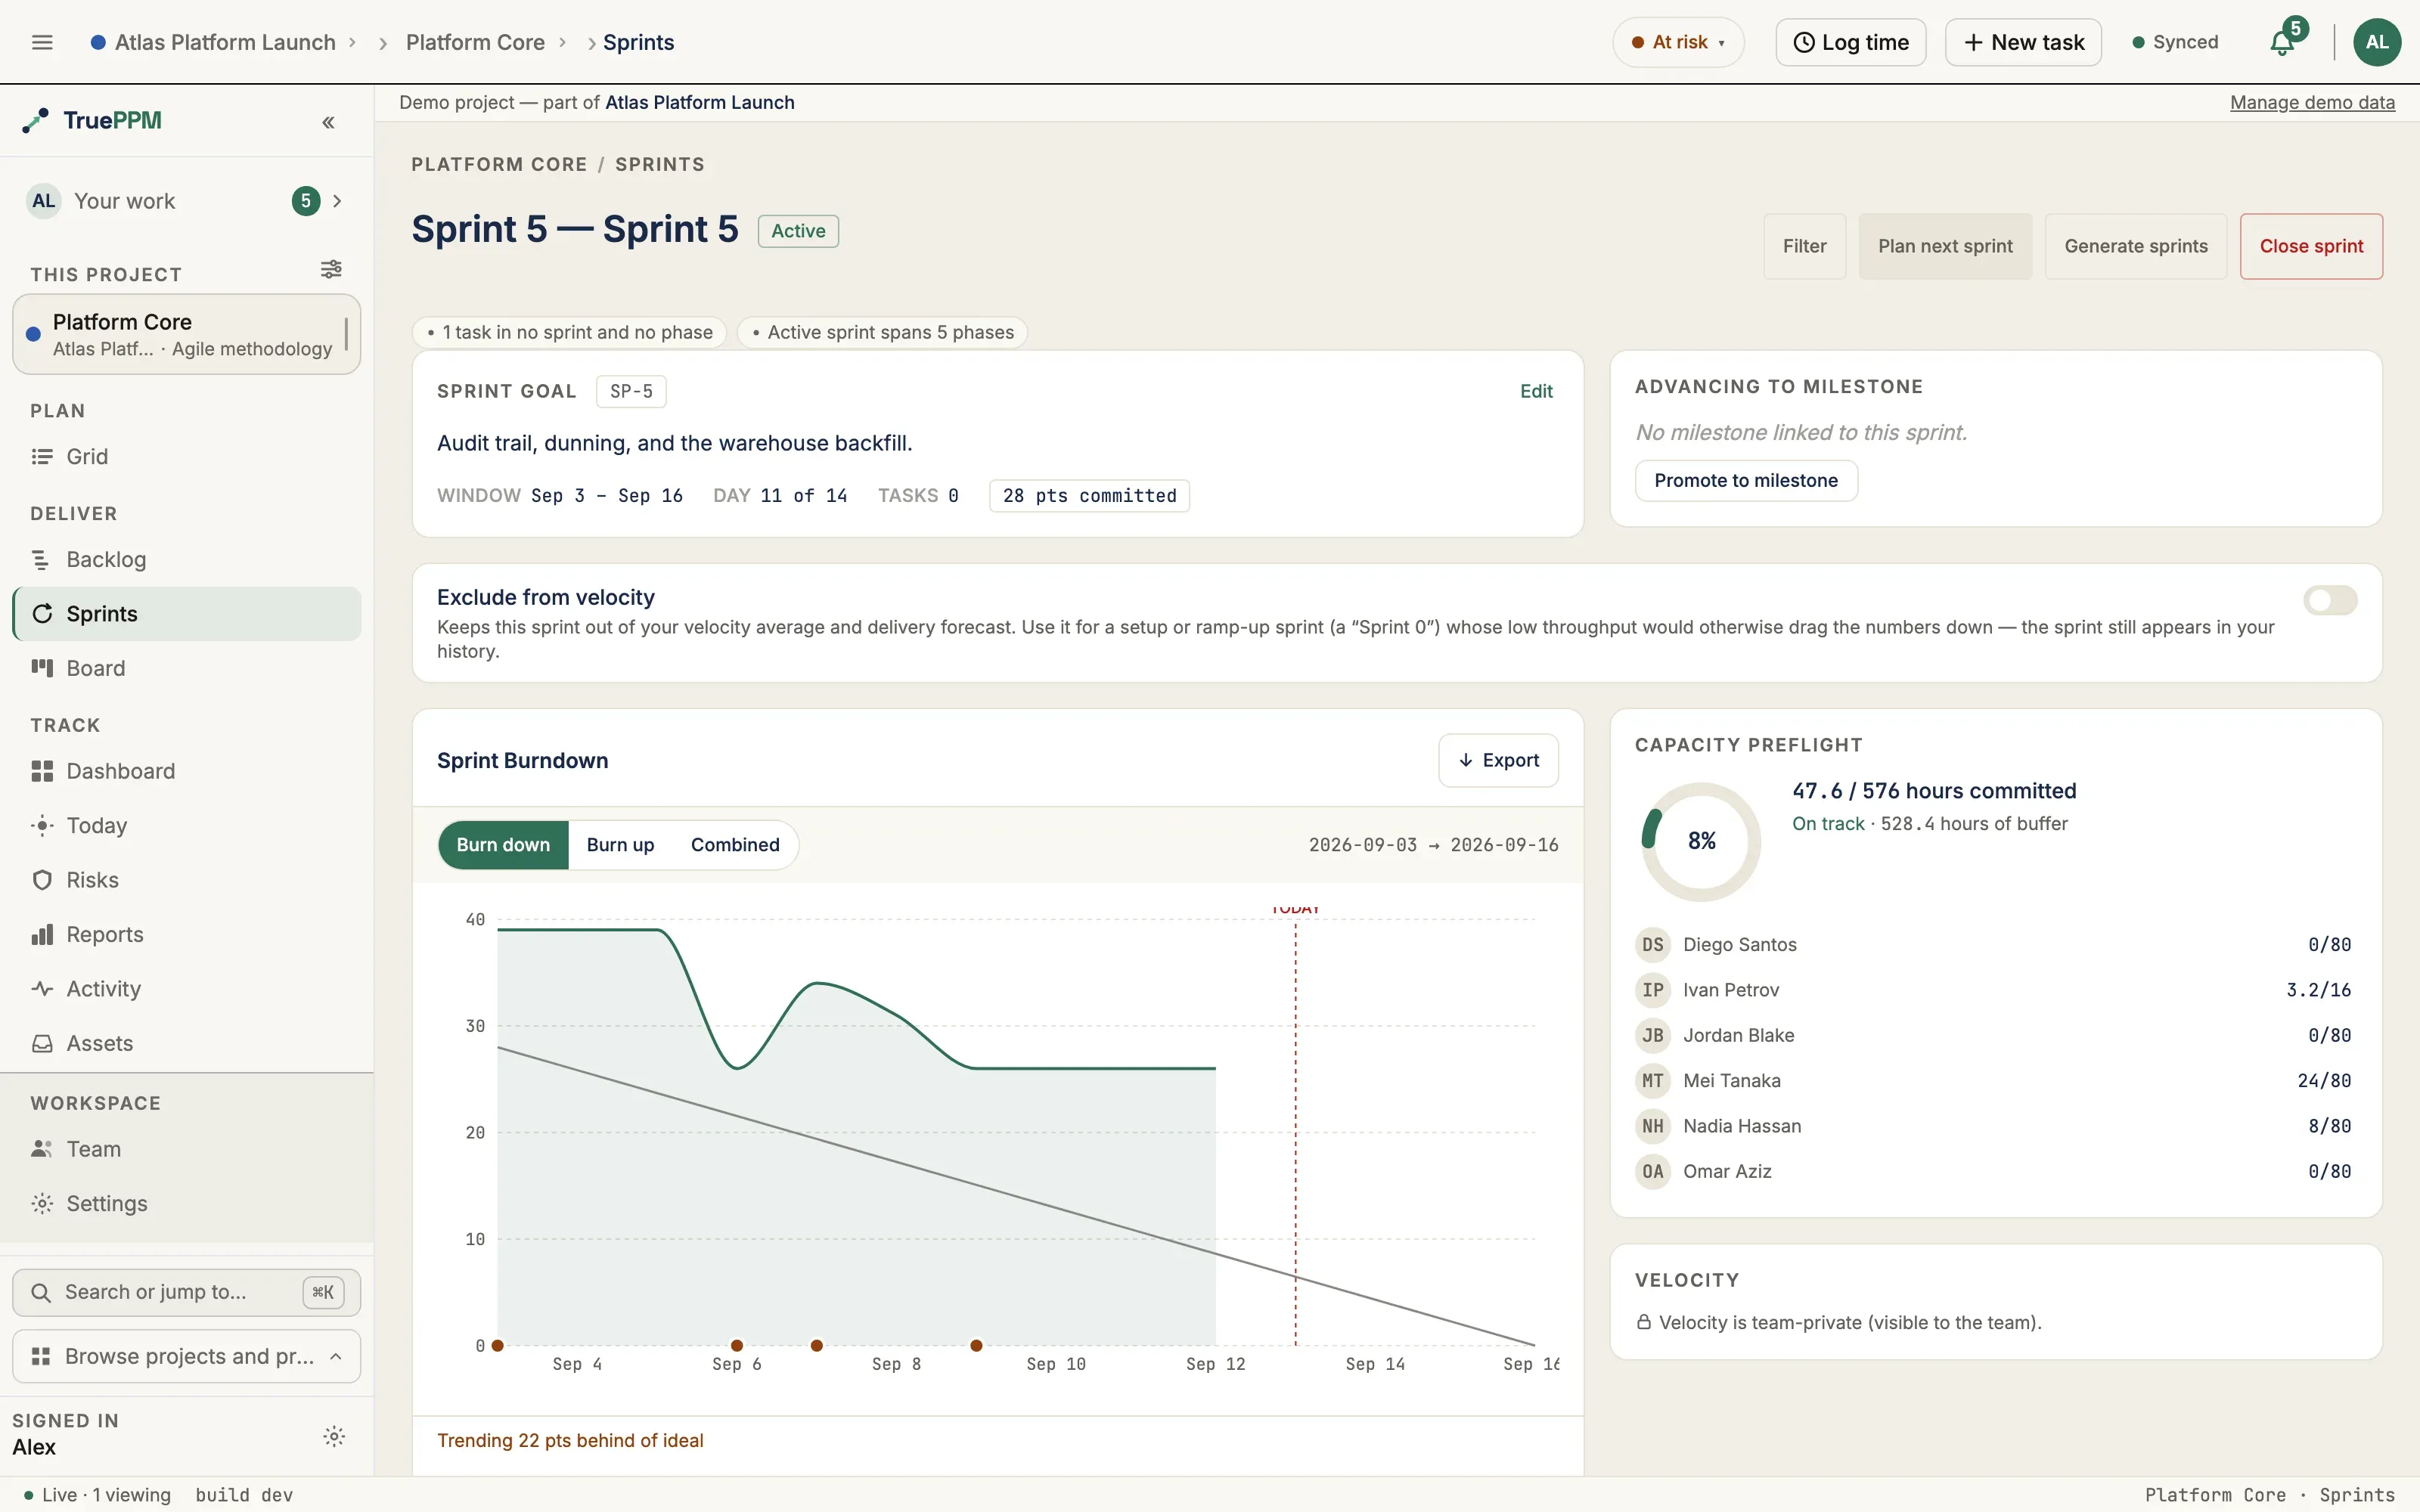
This is for anyone tracking how a sprint is progressing — the Scrum Master watching for trouble, or a PM checking whether the team is on pace. A burndown chart tracks how much work is left in the current sprint, day by day, against how much should be left if the team stays on pace — so a chart that trends toward zero on schedule means the sprint is healthy, and one trailing above the line means work is falling behind. The chart shows the Actual line (solid), the Ideal pace line (dashed), amber dots marking days when new work was added mid-sprint, and a vertical line marking today — with a trending callout below the chart and a forecast close date to the right.
Where this lives in the story
Section titled “Where this lives in the story”Step 6 (Execute) of the hybrid PM flow — this is the chart Alex watches during the standup and the chart Janet’s exec view derives confidence from at Step 7.
What you see
Section titled “What you see”- Y-axis: remaining story points
- X-axis: working days of the sprint (Day 1 → Day N)
- Today marker: vertical dashed
semantic-criticalline labeledTODAY - Trending callout:
Trending {N} pts ahead/behind of ideal · scope-add {date} (+{N} pts)— color reflects on-track / at-risk - Forecast close: linear extrapolation from current pace to zero remaining
Burn up view
Section titled “Burn up view”A Burn down / Burn up / Combined toggle sits on the chart card. Burn up plots two ascending lines instead of the descending remaining line:
- Completed: cumulative completed points per day.
- Total scope: committed scope plus accepted mid-sprint injections (
committed_points + scope_change_points). When accepted scope is injected, this line steps up — making scope creep visible at a glance, which a burndown alone hides (a flat burndown can mean “no work done” or “work done but matched by added scope”). Combined overlays remaining, completed, scope, and ideal on one chart.
Where to find it in the app
Section titled “Where to find it in the app”- Sprints view (
/projects/:projectId/sprints, left ~60% of the metrics row) — renders for the active sprint; selecting a closed sprint shows its frozen historical burndown in the read-only review. - Reports → Metrics (
/projects/:projectId/reports) — the full sprint-scoped burndown with a sprint selector (defaults to the active sprint), alongside the project burn chart. This is the reporting home for the burndown. - Board (
/projects/:projectId/board) — deliberately demoted so the Kanban columns are the primary content: the sprint header carries a compact at-a-glance sparkline, and the full chart is a pull-on-demand “Burndown” disclosure inside the (collapsed-by-default) sprint panel. The board is never blocked by the chart on open.
API endpoints
Section titled “API endpoints”| Method | Endpoint | Purpose |
|---|---|---|
GET | /api/v1/sprints/{id}/burndown/ | Sprint metadata + actual snapshot series |
The ideal line is computed client-side from committed_points; the API does not return it.
Where the data comes from
Section titled “Where the data comes from”SprintBurnSnapshotrows are written daily at 01:00 UTC by theupdate_sprint_burndown_snapshotsBeat task.- Real-time UPSERTs fire from the
task_status_changedsignal whenever a task in the active sprint changes status — today’s row stays current without waiting for the nightly job. - Scope-change markers (
scope_change_points) signal mid-sprint scope additions/removals separately from burn movement.
Related ADRs
Section titled “Related ADRs”If you are…
Section titled “If you are…”- Alex — your at-a-glance sprint health. The trending callout tells you whether to escalate at standup.
- Janet — you don’t open this directly. You read the aggregate milestone-health and schedule-confidence signals; the velocity forecast it feeds is team-private by default (ADR-0104) and visible to you only when the team’s signal audience includes your tier.